Trump Support Surges Among Pennsylvania’s Puerto Ricans
A precinct-level analysis of the Puerto Rican strongholds of Allentown, Reading, and North Philadelphia shows that these areas swung harder to the right than the rest of the state.
US Shadow Senator for Puerto Rico, Zoraida Buxó Santiago, speaks at a Trump campaign rally in Allentown, PA on October 29th, 2024. Angela Weiss/AFP via Getty Images.
Many people were wondering whether Tony Hinchcliffe’s Comedy Central Roast of Puerto Rico would undermine Donald Trump’s re-election bid, particularly in Pennsylvania. The Keystone State is home to the largest number of Puerto Ricans on the mainland outside of New York - more than half a million in total - where they represent a potentially decisive voting bloc. Well, the results are in, and not only did Trump win Pennsylvania, but Puerto Rican-majority areas swung harder to the right than most other places in the state. To understand last night’s outcome, let’s begin by examining the results of the last three presidential elections in Pennsylvania’s various geographic regions: Philadelphia, the Collar Counties (Bucks, Chester, Delaware, Montgomery), the Lehigh Valley (Lehigh and Northampton Counties), the Wyoming Valley (Lackawanna, Luzerne, and Wyoming Counties), Allegheny County (Pittsburgh and its suburbs), and Pennsyltucky (all other counties in the state).1
The first thing to note is that Pennsyltucky represents almost half of the electorate, and that Republicans typically win it by around thirty points. The big question in every election is whether or not Democrats can win the state’s major population centers by margins convincing enough to overcome this deficit - no easy feat. Combined, Philadelphia and Allegheny County represent only around twenty-two percent of the electorate, which is just about the same share as the Collar Counties. The remainder - around eight percent of the electorate - is split between the historic industrial hubs of the Lehigh and Wyoming Valleys. In recent cycles, Democrats have enjoyed a slight advantage in the former while Republicans have enjoyed a slight advantage in the latter, and so they’ve more or less canceled each other out.
The second thing to note is that Joe Biden managed to claw back Pennsylvania by modestly improving on Hillary Clinton’s performance in every region except Philadelphia, where Democratic support saw a modest decline. Between 2016 and 2020, Democrats improved their margins by five points in the Collar Counties, three points in the Lehigh Valley, four points in the Wyoming Valley, three points in Allegheny County, and two points in Pennsyltucky, while Republicans improved their margin by four points in Philadelphia. It’s also worth noting that the vast majority of Biden’s improvement over Clinton came at the expense of third-party candidates rather than Trump. Between 2016 and 2020, Trump’s share of the vote declined by only a single point in the Collar Counties and the Wyoming Valley. His share was even in the Lehigh Valley and Allegheny County and grew by one point in Pennsyltucky.
Here’s where things get interesting. Notice that while all six regions of the state swung marginally to the right this year relative to 2020, Kamala Harris still did better than Clinton did in the Collar Counties, the Lehigh Valley, the Wyoming Valley, Allegheny County, and Pennsyltucky, both in terms of her vote share and raw vote total. Unfortunately for her, Trump also improved on his 2016 numbers in each of these regions - plus Philadelphia. In other words, while Democrats picked up almost all of the 2016 third-party vote in 2020, about half of that vote went over to Trump this year. So that was Harris’ first problem.
Her second problem was a turnout collapse in Philadelphia and the Collar Counties. In the City of Brotherly Love, Harris won 75,000 fewer votes than Biden and 55,000 fewer than Clinton. In the Collar Counties, Harris won 100,000 more votes than Clinton but 70,000 fewer than Biden. In other words, Harris was only able to activate about half of the suburban voters who came out for Biden in 2020 after sitting out 2016, while the party’s support in Philadelphia sank below 2016 levels. It’s also worth noting that while Trump did improve on his previous performances in Philadelphia both in terms of his vote share and raw vote total, he didn’t improve by nearly as much as Democrats collapsed. The bottom line is that hundreds of thousands of Clinton and Biden voters in the state’s bluest counties simply didn’t show up to the polls this year.
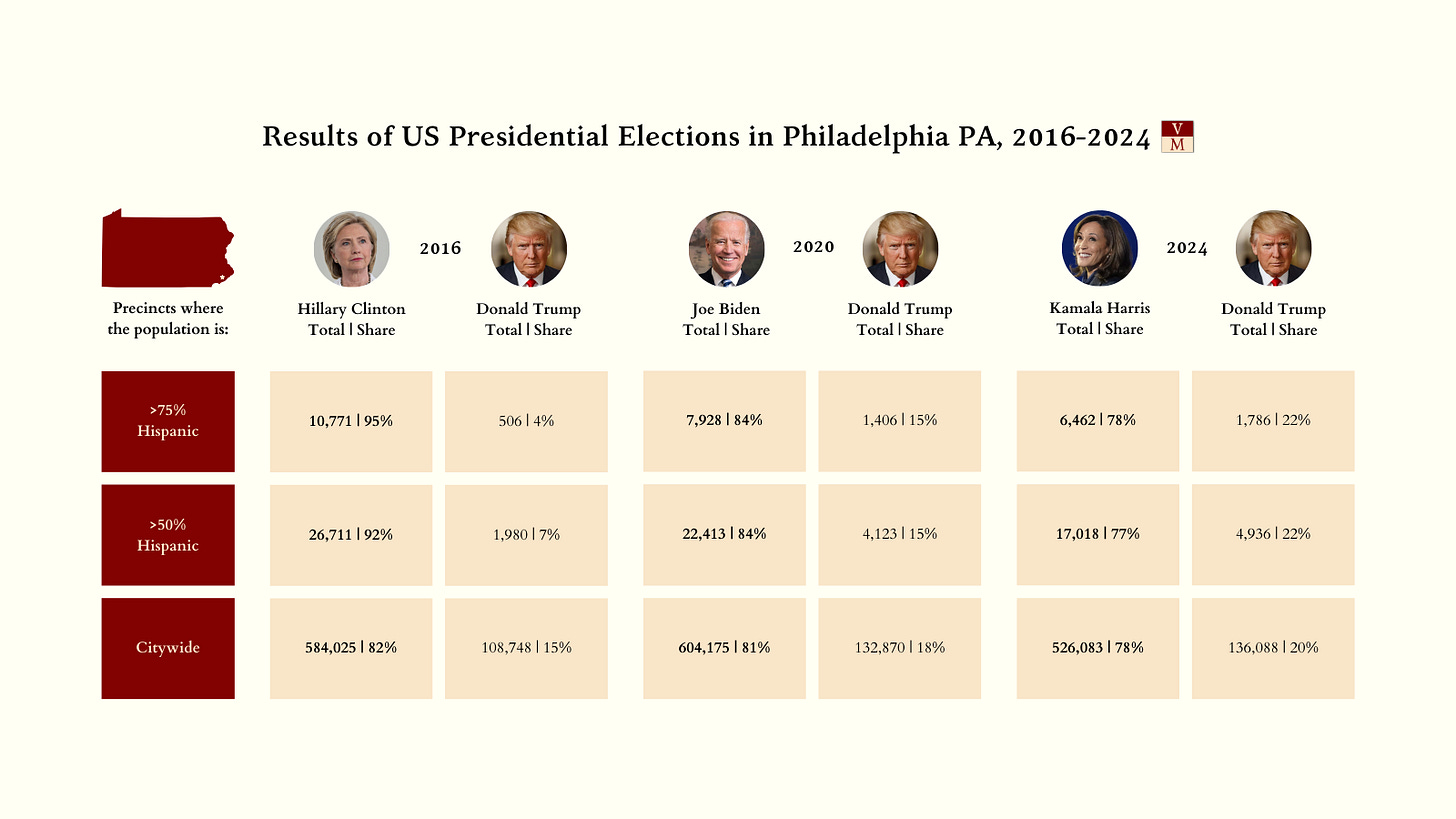
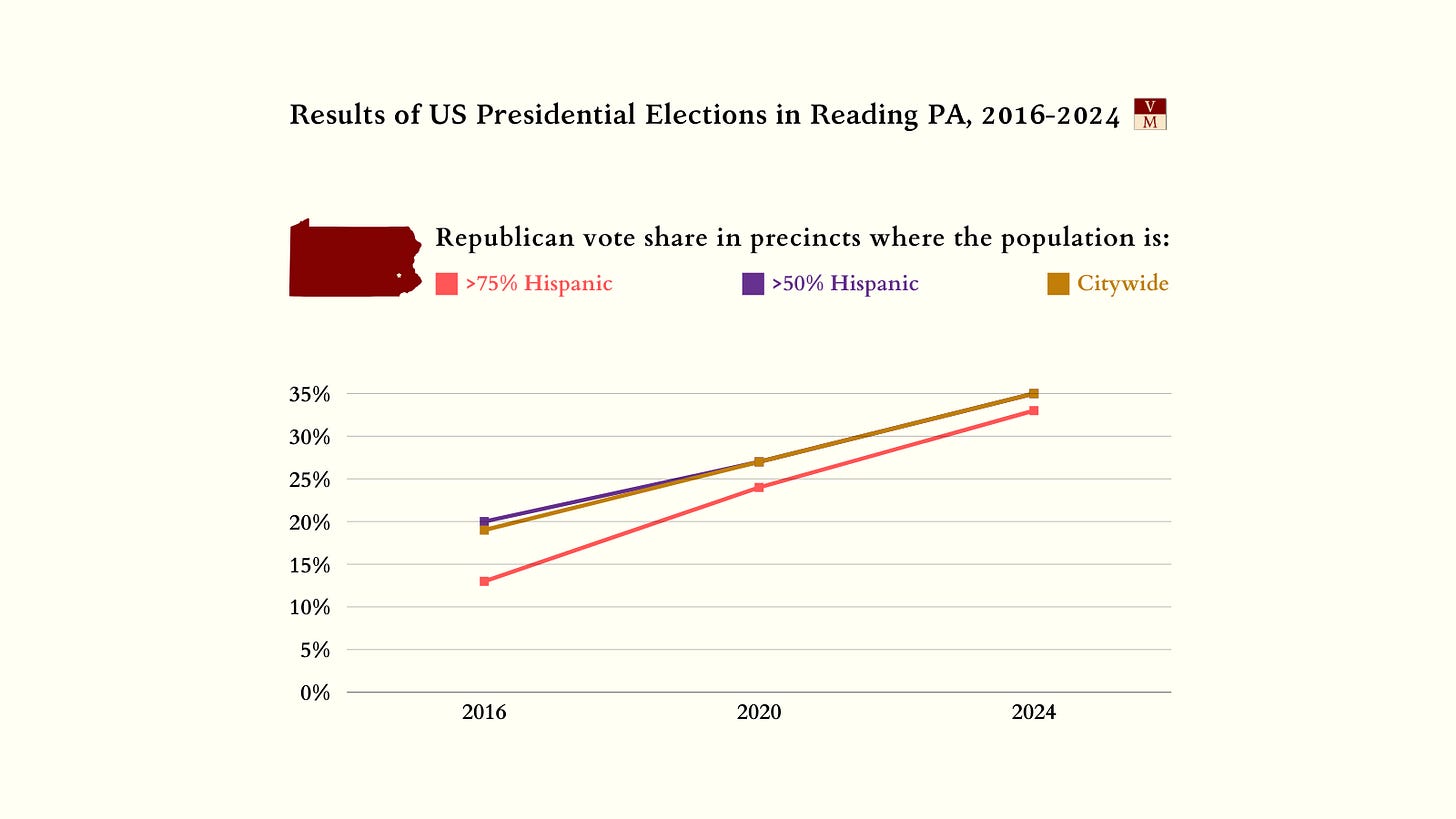
Now that we understand the state’s trajectory as a whole, we can turn to the Puerto Rican question. Many people don’t know that the third- and fourth-largest cities in Pennsylvania – Allentown and Reading, respectively – are actually majority-Puerto Rican, and North Philadelphia is also a Puerto Rican stronghold. To understand this community’s evolution, let’s consider the outcomes of the last three presidential elections in each of these cities’ majority-Hispanic precincts. Some non-Puerto Rican Hispanics will be mixed in, of course, but the numbers are still illuminating.2
In Philadelphia, precincts that are more than fifty percent Hispanic swung thirty points to the right between 2016 and 2024. In precincts that are more than seventy-five percent Hispanic, the swing was a whopping thirty-eight points. Now granted, the scale of this improvement is due in part to the fact that Trump had almost no support at all in these precincts during his first campaign – though in some ways, that makes his achievements here all the more impressive. Of course, Trump hasn’t added nearly as much support as Democrats have bled. Harris won 10,000 fewer votes than Clinton did in precincts that are more than fifty percent Hispanic, and 4,000 fewer votes in precincts that are more than seventy-five percent Hispanic. Trump only added 3,000 and 1,200 votes in these clusters, respectively, relative to 2016.
In Allentown, precincts that are more than fifty percent Hispanic swung twenty-eight points to the right between 2016 and 2024. In precincts that are more than seventy-five percent Hispanic, the swing was an eye-popping forty-one points. There is also greater parity here than in Philadelphia between Harris’ losses and Trump’s gains in terms of raw vote totals. Harris won 2,800 fewer votes than Clinton did in precincts that are more than fifty percent Hispanic, while Trump added 3,400 votes in such precincts relative to 2016. In precincts that are more than seventy-five percent Hispanic, Harris won 600 fewer votes than Clinton while Trump added 400 more votes to his 2016 total.
In Reading, precincts that are more than fifty percent Hispanic swung twenty-seven points to the right between 2016 and 2024. In precincts that are more than seventy-five percent Hispanic, the swing was thirty-nine points. As in Allentown, Democratic attrition was less of a problem than it was in Philadelphia. Harris won 1,900 fewer votes than Clinton did in precincts that are more than fifty-percent Hispanic, while Trump added 1,500 votes in such precincts relative to 2016. In precincts that are more than seventy-five percent Hispanic, Harris won 2,400 fewer votes than Clinton while Trump added 1,500 more votes to his 2016 total. The results from both Allentown and Reading serve to highlight the turnout crisis confronting Philadelphia, where the problem of attrition seems uniquely severe.
For several years, Vulgar Marxism has been covering the phenomenon of racial realignment in New York, where the trends described here are unfolding as well. Critics have accused me of celebrating these developments in service of some red-brown aspirations they believe I have, but the truth is just the opposite. I’d love nothing more than for the left to stanch this bleeding and forge a new coalition of the multiracial working class – one that can stand up to the forces of reaction that are riding roughshod over our country. But the first step is admitting you have a problem. The left must confront the fact that its base is shifting to the right to have any hope of winning it back. Self-righteous and self-deluding narratives about Trump’s exclusive appeal to the white nationalist set only make this task harder. Reaction can come for anyone, and it’s up the left to meet people where they are and offer a real alternative.
To see the raw data for Pennsylvania, click here.
To see the raw data for Philadelphia, click here. To see the raw data for Allentown, click here. To see the raw data for Reading, click here. Please note: numbers are current as of 8am on Wednesday, November 6th, 2025, with more than 95 percent of the vote counted. While the numbers may shift somewhat on the margins as the final votes are counted, such changes will not impact the overall trends discussed here.


